

Screenshots show example data: shop and product names are placeholders.
Key terms
These definitions are the ones every figure on the page uses.- Reference price (RRP): The price of the product on the price level its market is compared against: the market’s Compared against level, or, when that is empty, the catalog price level marked as the recommended retail price. The page calls it “RRP”, or quotes the level’s name when it shows it.
- Fresh offer: An active offer of a product you track, matched in a market in view, whose page was scraped within the freshness window. Prices older than the window (7 days by default) are left out of every figure. The window is the Competitor freshness window (days) setting, shared with the Repricer; see Settings.
- Comparable offer: A fresh offer that can be put against its reference price. An offer is not comparable when its product has no reference price, when the offer is in a different currency from the reference, when the reference is zero or negative, or when the reference changed after the price was seen and Omnilinker cannot tell which reference applied. Offers that are not comparable are left out of every figure.
- Deviation: How far the offer’s price is from the reference, as a percentage of the reference, rounded to 0.1 point. Every decision uses this rounded value, so what you see on screen is what was judged.
- Tolerance: How far from the reference a price may be before it counts as a gap, in either direction. The default is ±5%. An offer exactly at the tolerance is within it. Set it in Compliance settings.
- Gap: A comparable offer whose deviation is more than the tolerance below or above the reference.
- Compliant offer: A comparable offer within the tolerance, or a gap below the reference covered by an agreed promotion.
- Compliance: Compliant offers as a share of comparable offers, shown to one decimal place. It counts offers, not resellers or products.
At the edge always spans one point beyond your tolerance; Moderate, Deep and Critical start at fixed
depths.
A reseller that has moved first on a product is marked Moved first: its price change opened the gap, and no
other reseller had changed that product’s price in the previous 24 hours. Omnilinker shows it only when at least three
resellers had a comparable offer of the product at that moment. It says who changed a price first, never why.
Term hints and the glossary
The dashboard explains its own terms, using your tolerance in every definition (for example “within ±5% of RRP”).- Term hints: a label with a dotted underline has a definition card. Point at it for a moment, move to it with Tab, or click or tap it. The card shows the term, what it counts, the definition and, where the word is narrower than it sounds, Not counted: what it leaves out. Press Esc or click × to close it. Hints are on the column headings of the trend table and of Resellers furthest off RRP, and on each reseller’s status in that table.
- The glossary: click Terms in the page header, or All terms on a card, to open What the terms mean. Terms are grouped as Trend, Resellers, Gap depth and Cases; opened from a card, the glossary starts at that term’s group. Type in Find a term to search every term, including the Not counted lines. The search ignores case and accents. The footer names the tolerance the definitions use. Press Esc, click × or click outside the panel to close it.
The page header

- Market: the market in view, or All markets. You can pin a market as your home market; every page then opens on it.
- Brand: shown only when your tracked products span more than one brand. Choose one brand or All brands.
- Period: Last 7 days, Last 14 days or Last 30 days. Shown on the Overview tab only. The period sets which changes are counted and which earlier day the compliance figure is compared with.
- Send digest: opens the weekly compliance digest, which you can send to yourself or subscribe to. Shown on the Overview tab only. See What Send digest does. While the verdict is on hold, the button reads Digest paused and does nothing.
- Terms: opens the glossary, What the terms mean. Shown on every tab once the page has loaded. See Term hints and the glossary.
The status line
Under the title, a status line says what the figures are made of, for example:Fresh · 1,240 offers from 38 resellers on 3 sources · last scrape 21 Sep, 09:23 · prices older than 7 days are left out · 12 offers in EUR cannot be compared
- Fresh, Partial or No data: Partial means a data source in view has not completed a scrape within the freshness window (or never has) while it holds offers you know about, so the figures cover only what can be seen. No data means nothing in view is comparable.
- The offer count is every fresh offer, comparable or not. The reseller and source counts are those with fresh offers.
- last scrape is the most recent completed scrape of a source in view, in your organisation’s time zone.
- prices older than N days are left out is the freshness window.
- Offers that cannot be compared are named by reason: “in EUR cannot be compared”, “have no reference price”, “with a reference not known for their scrape”, “with a reference of zero or less”. With the View Price Violations permission, click one to open Offers that cannot be compared, which lists each offer and why.
- When your organisation has no time zone, the line ends with “Dates are in UTC: your organisation has no time zone set.”
Tabs
Overview tab
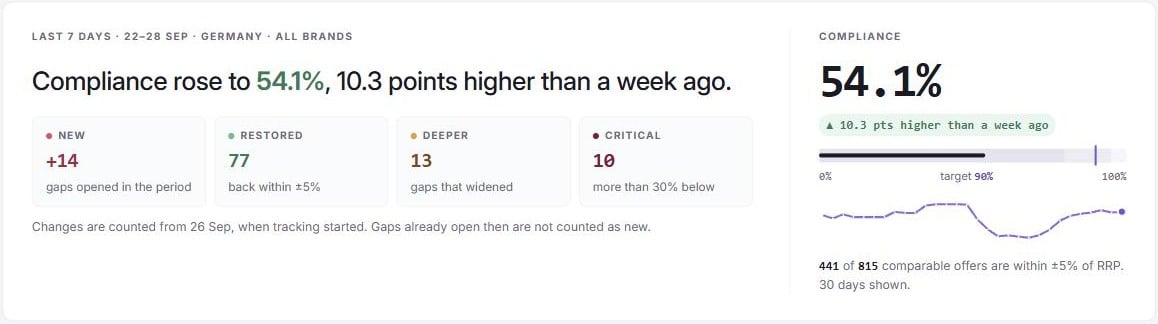
The verdict
The first sentence says where compliance stands, compared with the day before the period began (7, 14 or 30 days before today, in your organisation’s time zone):- “Compliance slipped to 86.4%, 3.1 points lower than a week ago.”
- “Compliance rose to …, … points higher than …” or “Compliance held at …, the same as …”.
- “Compliance is 86.4%.” when there is nothing fair to compare with: the earlier day has no complete data, it was judged under a different tolerance, or today’s figures cover a different set of sources (some are excluded or not scraped recently). In the last case a second sentence says what today’s figures leave out.
- All clear: compliance meets your target, there is nothing under Where to act (an ending agreed promotion does not count), and no source is silent. The verdict reads “Resellers are holding your prices.” The page then shows how many days you have been above target, What changed for the better and Worth watching: resellers with offers of three or more products in one product range sitting within half a point of the tolerance below RRP, and agreed promotions ending within 7 days.
- Verdict on hold: sources that have not been scraped within the freshness window, or never, hold 20% or more of the offers you know about. The page shows which sources are silent, the range compliance must lie in whatever the unseen offers are, and Show figures for …, which excludes the silent sources. Excluded sources are named in a banner, “Figures exclude …”, with Include it again. The digest is paused while the verdict is on hold.
- No data: “No offer in this scope can be compared with its reference price yet.”
What changed: New, Restored, Deeper, Critical
Four counters sit under the verdict. New, Restored and Deeper count changes in the period; Critical is a count of now.
Click New, Deeper or Critical to open All gaps filtered to exactly those gaps (with View Price
Violations). Under Restored, “N cases ready to close →” opens the Restored queue on the Cases tab when
there are such cases.
Gap history starts when the dashboard was first calculated for your organisation. If that falls inside the period, a
note under the counters says “Changes are counted from 21 Sep, when tracking started. Gaps already open then are not
counted as new.” Before the first calculation it says that nothing has been counted yet.
Compliance
The panel on the right shows:- the compliance percentage and target (your compliance target, 90% by default), drawn as a gauge;
- the change in points against the same earlier day as the verdict, for example “3.1 pts lower than a week ago”. It is left out whenever the verdict does not compare;
- “N of M comparable offers are within ±5% of RRP.” When agreed promotions cover some gaps, it reads “N of M comparable offers are compliant (within ±5% or in an agreed promotion).” instead;
- a sparkline of daily compliance over the last 30 days (“30 days shown.”). Days without complete data are left blank. When you have excluded sources, the note says the line still covers every source. Point at a day to see its hover card (see The compliance trend). With View Price Violations, a day that had new gaps says “Click to see the gaps that opened this day and are still open”, and clicking it opens All gaps filtered to those gaps.
Where to act
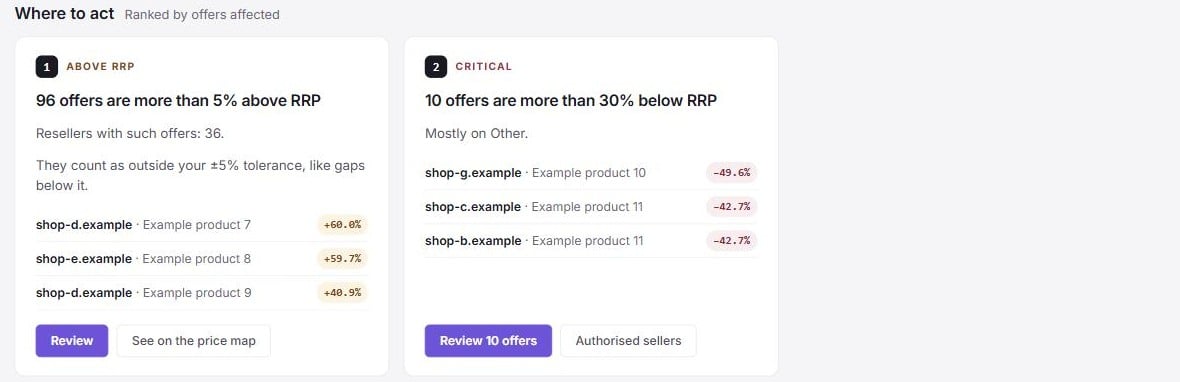
Covered gaps are not counted on any card except Agreed promotion ending.
The compliance trend
Compliance, last 30 days (or last 90 days) shows daily compliance against your target, drawn as a dashed Target line. The legend names Compliance, Target, This period (the days of the period you chose, shaded) and Reconstructed (days rebuilt later from stored prices, shaded). Days without complete data break the line: nothing is guessed. Under the line, New and restored gaps per day draws the day’s new gaps upwards and its restored gaps downwards. Two toggles sit above the chart:- Range: 30 days or 90 days.
- View: Chart, or Table, which lists the same days newest first with Day, Compliance, Within tolerance (for example “1,180 of 1,240”), new, restored, Source (Live data, Reconstructed from retained prices or No complete data) and a Pin button per day.
- the date, compliance and its change;
- the comparable offers within tolerance and the gaps per band (At the edge, Moderate, Deep, Critical, Above RRP);
- the day’s new and restored gaps and its events;
- which tolerance the day was judged at and where its figures come from, for example “Judged at ±5% · Live data”;
- Gaps that opened this day and are still open →, which opens All gaps filtered to that day, with gaps covered by an agreed promotion included (needs View Price Violations).
The 30-day range shows at most eight events, and the 90-day range at most sixteen.
When the range has no day with complete data, the chart reads “No complete days in this range yet”.
Depth and ledgers
- How deep the N gaps are: gaps not covered by a promotion, per band. It sits beside the trend while no day is pinned.
- Price gap, one unit per offer: the sum of (RRP − price) over the offers below RRP, per currency. It is a plain sum, not a sales forecast.
- Resellers furthest off RRP: the six resellers with the most gaps, with Off RRP (offers outside tolerance now, not counting covered ones, and the products they cover), Compliance (a dash when none of the reseller’s offers could be compared), 30 days (the reseller’s daily compliance, green while it is restoring prices, grey otherwise; point at a day for its hover card) and Status. All N → opens All gaps grouped by reseller.
- Products where the price moved most: the six products with the most resellers off RRP, with the Median deviation and Settled at, the price most resellers converged on. Settled at shows “none” unless at least 3 resellers, and at least 40% of them, hold one price.
Click a reseller’s name anywhere on the page to open its Reseller record (needs View Merchant Compliance):
its compliance over the period, what happened, its current gaps by product range, its contact details and account
manager, and the case actions you are allowed. Days below your target are shaded on its compliance line. Point at a
day for its hover card; with View Price Violations, click a day that had new gaps to open All gaps with this
reseller’s gaps that opened that day and are still open.
Price map tab
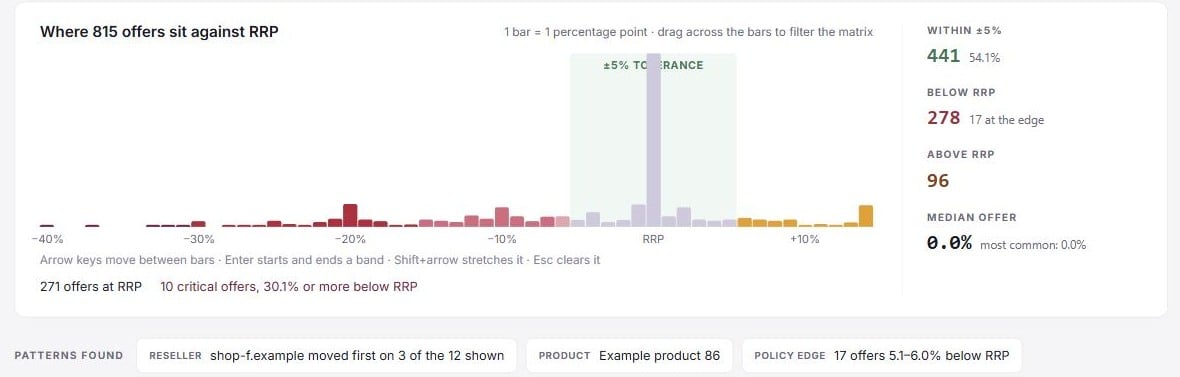
- The histogram (“Where N offers sit against RRP”): one bar per percentage point of deviation, coloured by band, with the ±tolerance band marked. The bars at each end also hold every offer further out. Drag across bars (or use the arrow keys and Enter) to select a band of deviations; the matrix then keeps only the products with an offer in it. Open these N gaps in All gaps opens exactly those offers in the register. Clear the band removes it.
- Stats: Within ±5%, In agreed promotions (only when promotions cover offers), Below RRP with how many are at the edge, Above RRP with the reseller holding most of them, and the Median offer deviation with the most common one.
- Patterns found: toggles that highlight what they count: a reseller that moved first on several of the products shown, a product where many resellers sit at one price, and the offers at the policy edge.
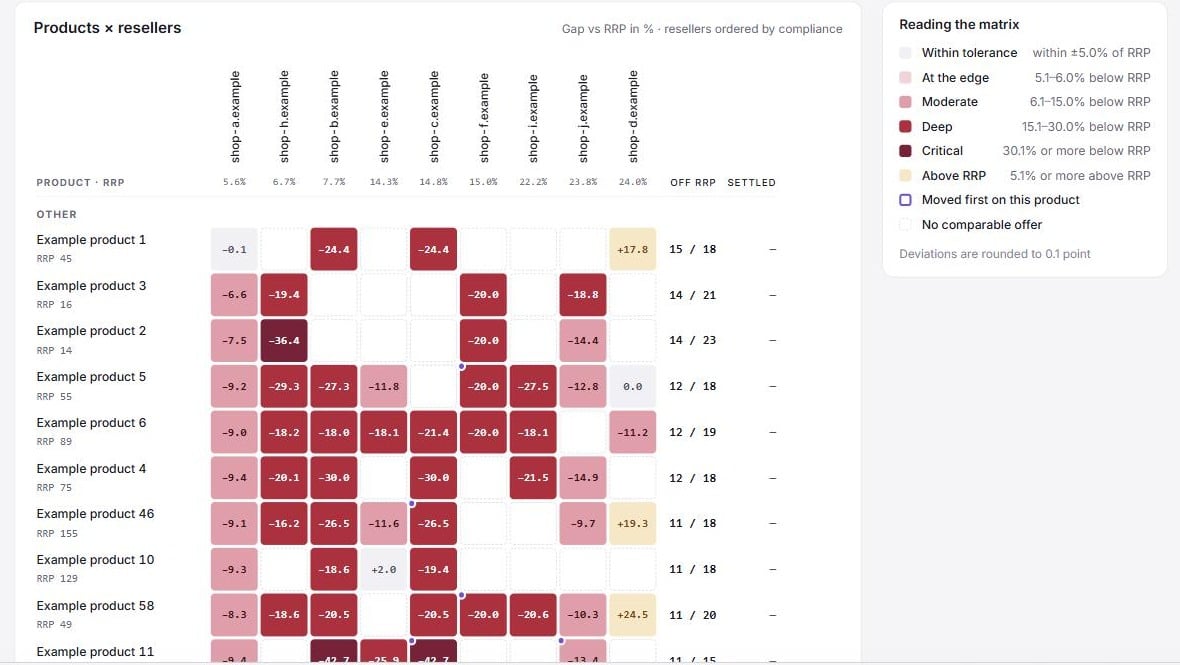
- Products × resellers: products in rows, grouped by product range, and resellers in columns, ordered by compliance. Each cell shows the reseller’s gap against RRP in %, tinted by band. When a reseller has several offers of a product, the cell shows the one furthest from RRP. A dashed cell means no comparable offer. A marker shows the reseller that moved first on that product. Show N more products loads more rows; the matrix shows up to 40 resellers.
All gaps tab
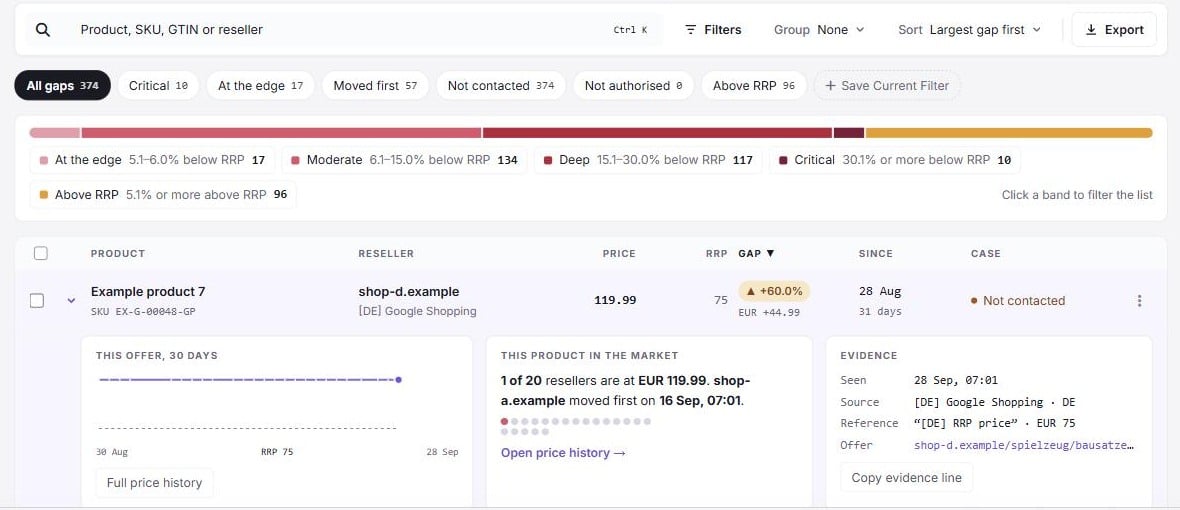
Columns
Click a row to show its details: the offer’s prices over 30 days, how many resellers are at the same price and who
moved first, and the evidence (when it was seen, source, reference and offer link). Point at the price line for each
price’s time and deviation, as in the price map’s Selected cell. Copy evidence line puts one line of evidence
on the clipboard.
The footer shows the rows on the page, the total and the sum of the gaps.
Views, search and filters
- Views: All gaps, Critical, At the edge, Moved first, Not contacted (no case of their own, or a case with no message yet), Not authorised and Above RRP. You can also save the current view and filters as your own view.
- Search: product, SKU, GTIN or reseller.
- Gaps by depth: click a band in the strip to filter the list to it.
- Filters: Depth (bands, or a deviation range in whole-point steps, as on the price map), Include gaps covered by an agreed promotion, Case status, When (Opened or Deepened in the last 7, 14 or 30 days), and lists of resellers, products, sources and product ranges. Active filters show as chips above the list. A link from a day on a trend or compliance line adds the chip Opened on with that date: only gaps that opened that day and are still open. It replaces an Opened window; choose Anytime under When, or remove the chip, to clear it.
- Group: None, Reseller, Product, Product range, Source or Case status. A reseller group offers Start case or Open case.
- Sort: Largest gap first, Newest first, Oldest first, Largest amount first, Reseller A–Z, Product A–Z. Groups sort by Most gaps first, Deepest gap first, Most recent first or Name A–Z.
Acting on several gaps
Select rows to show the bulk bar. You can act on up to 500 gaps at once.- Add to case: adds the gaps to each reseller’s open case in that market, or starts one (Manage cases).
- Mark as agreed promotion: records a promotion for the selected gaps below RRP, one per reseller and market (Agreed promotions). See Agreed promotions.
- Snooze: snoozes the cases the gaps are in. Every selected gap must already be in a case.
- Export evidence: exports the selected rows (Export Data).
Export
With the Export Data permission, click Export:- Which rows: Current view (market, brand, filters and search), Selected rows, or Every gap (all markets and brands you can see).
- Format: Excel (one sheet), CSV, or Evidence pack (one CSV per reseller plus a summary, zipped).
- Include: offer URL and scrape time for every row; who moved first and the case status; and, for Excel and the evidence pack, the offers that cannot be compared.